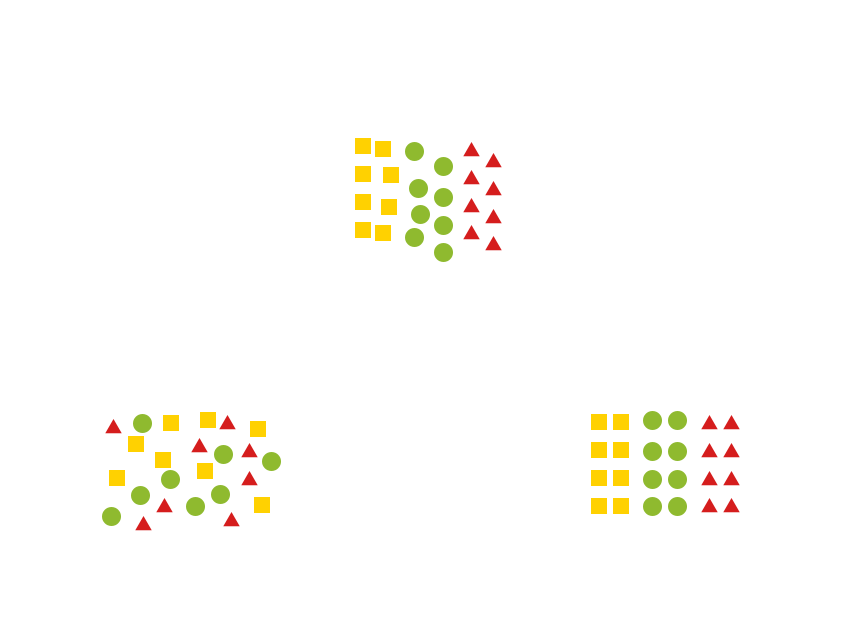
Connecting and shaping data for meaningful insights
Creating relationships and data models to improve data usability
Analysing complex datasets with DAX (Data Analysis Expressions)
Visualising insights through intuitive dashboards
Transitioning workflows and reporting systems from Excel to Power BI for better scalability
Connecting and shaping data for meaningful insights
This refers to gathering data from different sources (e.g., databases, spreadsheets, APIs) and transforming it into a clean and organised format. The goal is to make the data suitable for analysis, ensuring it is structured in a way that allows meaningful insights to be drawn, often using tools like Power Query in Power BI.
Creating relationships and data models to improve data usability
Creating relationships involves linking different data tables in a way that makes sense (e.g., joining customer data with sales data). A data model is a structure that defines how these tables interact. By organising data in a logical model, it becomes easier to analyse and use, improving accessibility and ensuring data integrity.
Analysing complex datasets with DAX (Data Analysis Expressions)
DAX is a formula language used in Power BI to perform calculations and aggregations on data. This sentence refers to using DAX to analyse complex datasets, creating custom calculations, measures, or key performance indicators (KPIs). DAX helps perform advanced analytics, such as running totals, time intelligence, and filtering, to derive deeper insights.
Visualising insights through intuitive dashboards
This refers to presenting data in a visual format (e.g., charts, graphs, tables) that is easy for stakeholders to understand. Dashboards in Power BI allow users to display and interpret data quickly, monitor KPIs, and make data-driven decisions. The aim is to transform raw data into clear, actionable insights through interactive visuals
Transitioning workflows and reporting systems from Excel to Power BI for better scalability
This refers to moving from Excel-based reporting systems to Power BI, which offers greater scalability and efficiency. While Excel can be limiting for handling large datasets, Power BI provides powerful data modelling, automation, and advanced visualisation tools, allowing organisations to manage and analyse data more effectively as they grow.